> ## Documentation Index
> Fetch the complete documentation index at: https://docs.dialai.ca/llms.txt
> Use this file to discover all available pages before exploring further.
# Dashboard
> View real-time and historical metrics for conversations and agent performance
 The **Dashboard** page is your operational hub: it surfaces the day's volume and outcomes, a live snapshot of in-flight work, and configurable historical reporting. Accessed via **Monitor > Dashboard**, it's the place to land when you want a single answer to "how are things going right now?"
## Accessing the Dashboard
Navigate to **Monitor > Dashboard** in the left sidebar. The page opens to three tabs:
1. **Daily Dashboard** — real-time and day-to-date metrics
2. **Custom Reporting** — configurable analytics with custom date ranges
3. **Scheduled Report** — automated report delivery on a recurring schedule
***
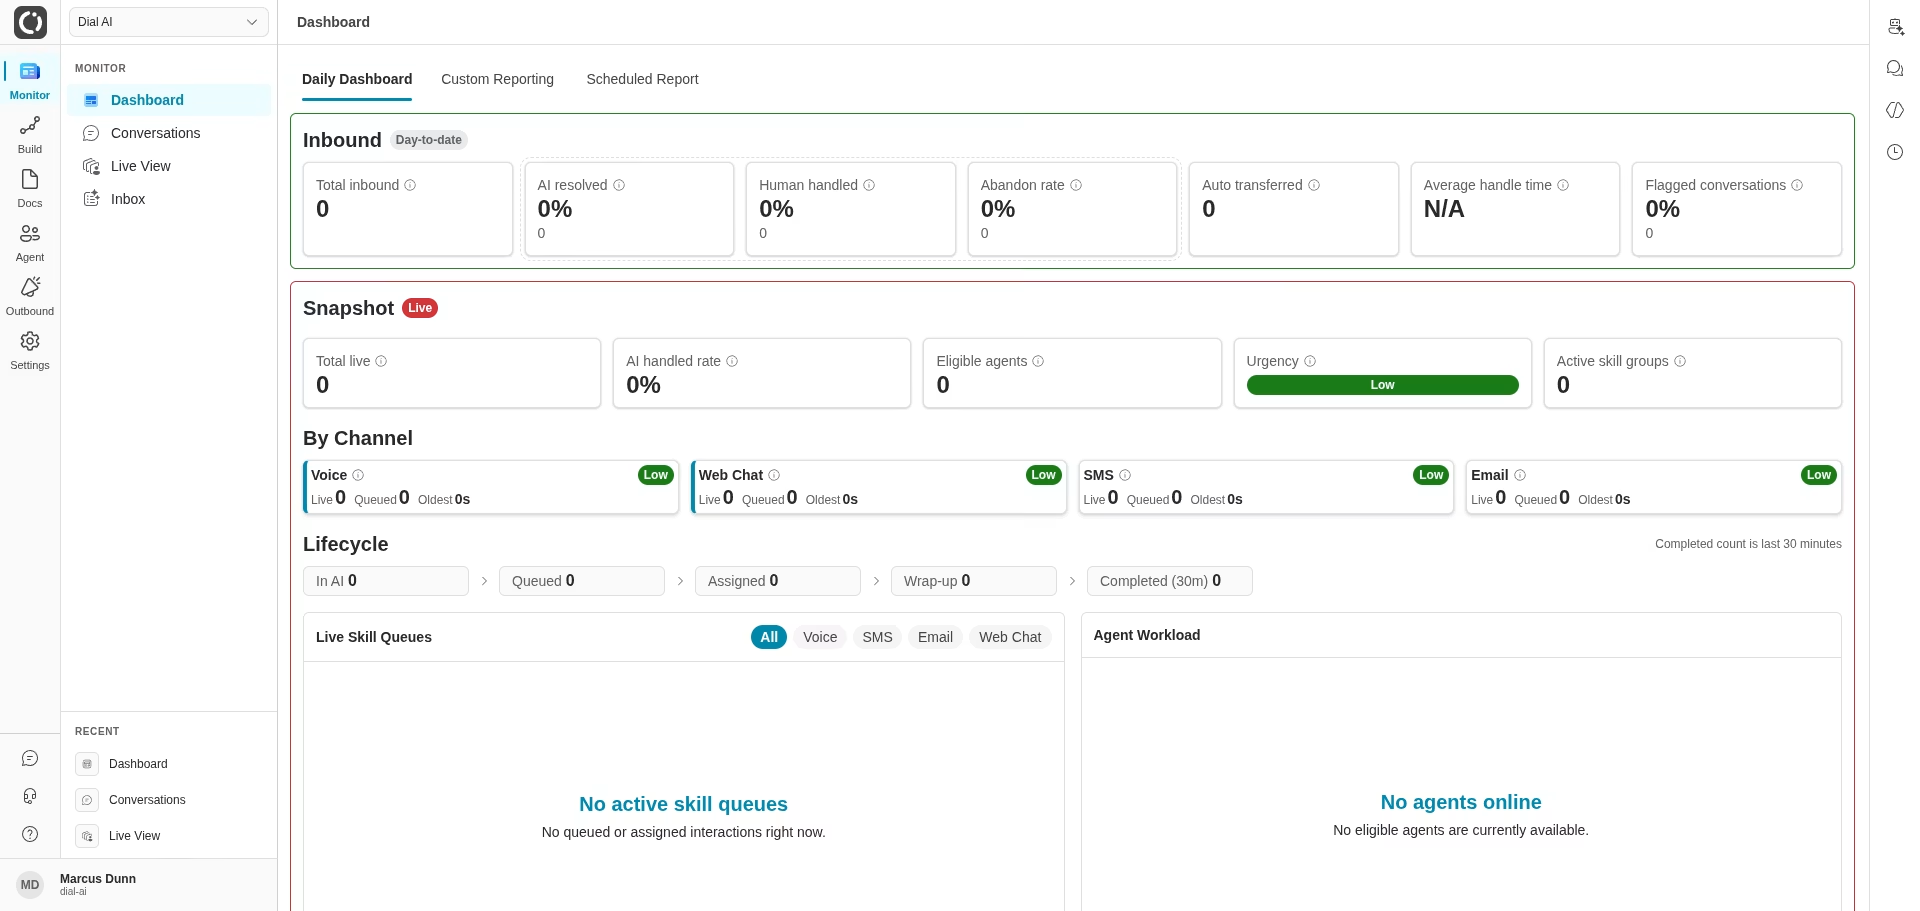
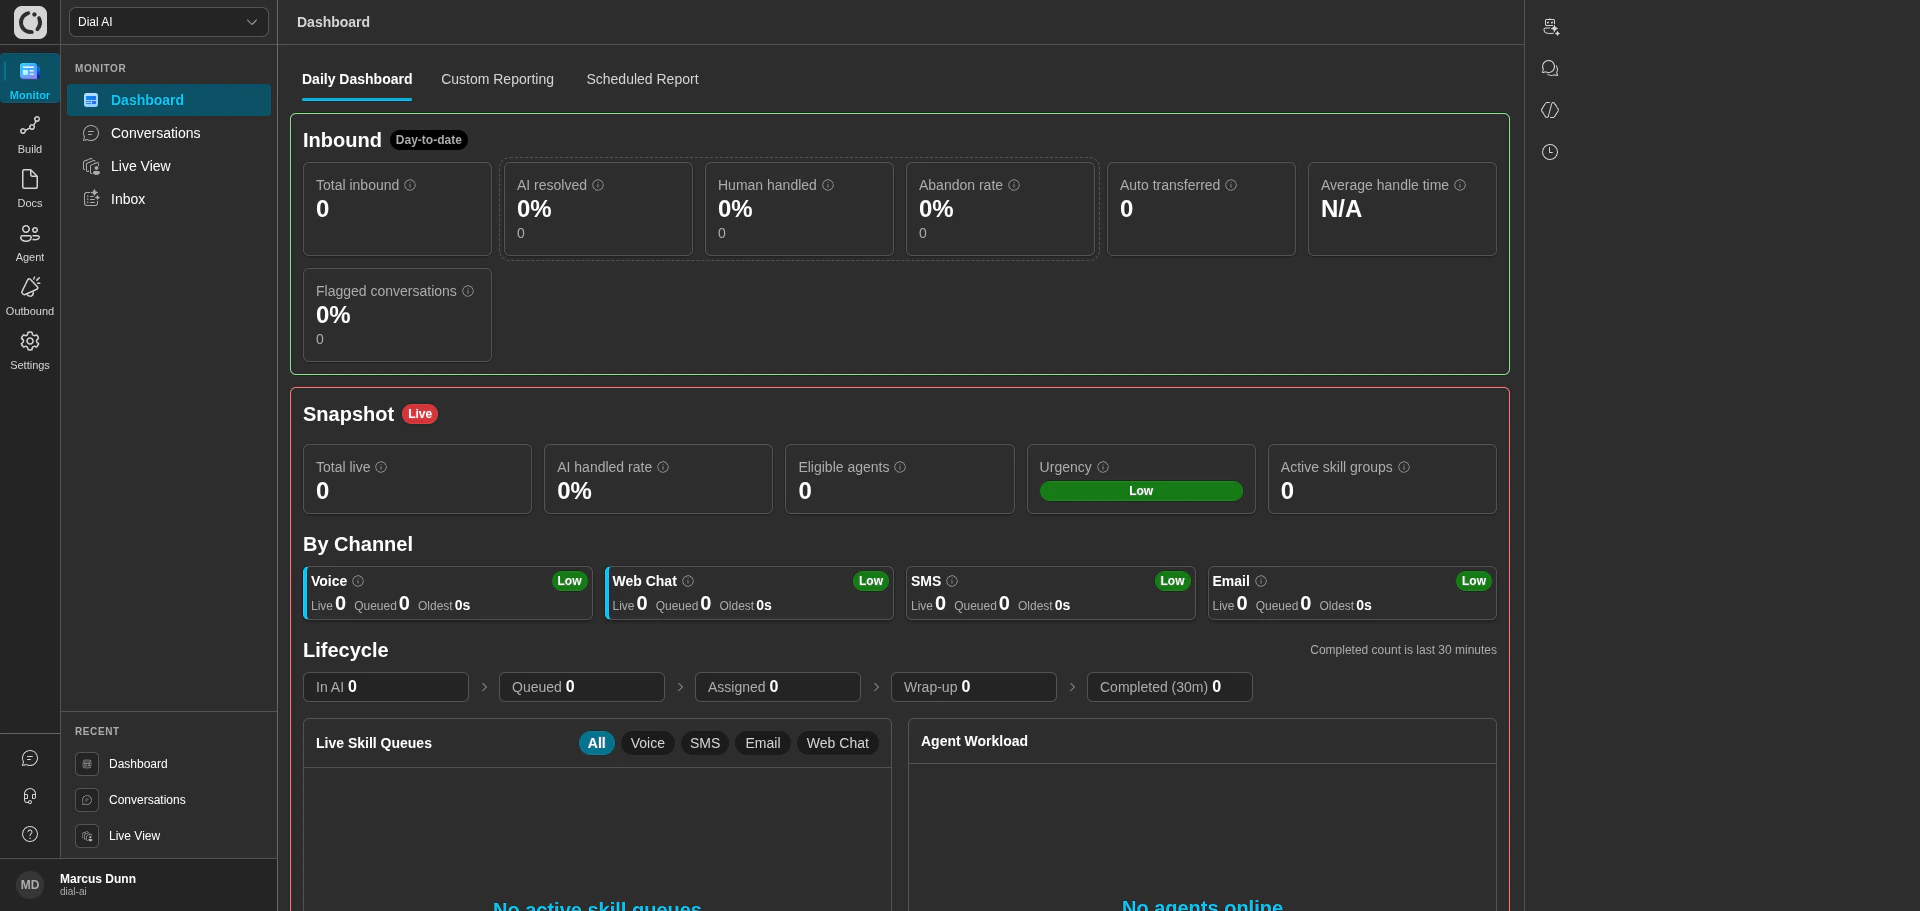
## Daily Dashboard tab
The Daily Dashboard balances today's accumulating numbers (Today) with a live operational pulse (Snapshot, By Channel, Lifecycle, Live Skill Queues, Agent Workload).
### Today (day-to-date)
Cards along the top show what has accumulated since the start of today:
* **Total inbound** — every inbound interaction received today, excluding still-in-progress conversations and auto-transferred calls.
* **AI resolved** — share of today's resolved inbound interactions that the AI fully handled.
* **Human handled** — share that required a human agent.
* **Abandon rate** — share that were abandoned before resolution.
* **Auto transferred** — inbound calls auto-routed to a human outside the AI flow. Tracked separately and not counted in Total inbound.
* **Average handle time** — mean time from assignment to completion for today's human-handled conversations.
* **Flagged conversations** — share of resolvable inbound conversations flagged for review today.
### Snapshot (live)
Real-time operational status across the whole platform:
* **Total live** — active interactions across AI, queued, assigned, and wrap-up.
* **AI handled rate** — share of live interactions currently handled by AI.
* **Eligible agents** — human agents online and eligible to take interactions.
* **Urgency** — Low / Medium / High based on queued load vs available agents (no queue = Low, no agents = High).
* **Active skill groups** — distinct skill sets across queued and assigned work.
### By Channel
Per-channel cards (Voice, Web Chat, SMS, Email) show Live, Queued, Oldest wait time, and a per-channel urgency badge. Channel urgency thresholds: Voice and Web Chat at 1m/3m, SMS at 5m/15m, Email at 30m/2h (Medium / High respectively).
### Lifecycle
A pipeline visualization of in-flight work: **In AI → Queued → Assigned → Wrap-up**, plus a **Completed (30m)** column showing how many wrapped in the last 30 minutes.
### Live Skill Queues
A queue list filtered by channel — tabs for All, Voice, SMS, Email, and Web Chat. Shows individual conversations waiting for assignment, useful for supervisors managing agent assignment manually.
### Agent Workload
Current work distribution across human agents. Each row shows the agent, their status (Available / Busy / Wrap-up / Offline), and current counts per channel.
***
## Custom Reporting tab
The **Dashboard** page is your operational hub: it surfaces the day's volume and outcomes, a live snapshot of in-flight work, and configurable historical reporting. Accessed via **Monitor > Dashboard**, it's the place to land when you want a single answer to "how are things going right now?"
## Accessing the Dashboard
Navigate to **Monitor > Dashboard** in the left sidebar. The page opens to three tabs:
1. **Daily Dashboard** — real-time and day-to-date metrics
2. **Custom Reporting** — configurable analytics with custom date ranges
3. **Scheduled Report** — automated report delivery on a recurring schedule
***
## Daily Dashboard tab
The Daily Dashboard balances today's accumulating numbers (Today) with a live operational pulse (Snapshot, By Channel, Lifecycle, Live Skill Queues, Agent Workload).
### Today (day-to-date)
Cards along the top show what has accumulated since the start of today:
* **Total inbound** — every inbound interaction received today, excluding still-in-progress conversations and auto-transferred calls.
* **AI resolved** — share of today's resolved inbound interactions that the AI fully handled.
* **Human handled** — share that required a human agent.
* **Abandon rate** — share that were abandoned before resolution.
* **Auto transferred** — inbound calls auto-routed to a human outside the AI flow. Tracked separately and not counted in Total inbound.
* **Average handle time** — mean time from assignment to completion for today's human-handled conversations.
* **Flagged conversations** — share of resolvable inbound conversations flagged for review today.
### Snapshot (live)
Real-time operational status across the whole platform:
* **Total live** — active interactions across AI, queued, assigned, and wrap-up.
* **AI handled rate** — share of live interactions currently handled by AI.
* **Eligible agents** — human agents online and eligible to take interactions.
* **Urgency** — Low / Medium / High based on queued load vs available agents (no queue = Low, no agents = High).
* **Active skill groups** — distinct skill sets across queued and assigned work.
### By Channel
Per-channel cards (Voice, Web Chat, SMS, Email) show Live, Queued, Oldest wait time, and a per-channel urgency badge. Channel urgency thresholds: Voice and Web Chat at 1m/3m, SMS at 5m/15m, Email at 30m/2h (Medium / High respectively).
### Lifecycle
A pipeline visualization of in-flight work: **In AI → Queued → Assigned → Wrap-up**, plus a **Completed (30m)** column showing how many wrapped in the last 30 minutes.
### Live Skill Queues
A queue list filtered by channel — tabs for All, Voice, SMS, Email, and Web Chat. Shows individual conversations waiting for assignment, useful for supervisors managing agent assignment manually.
### Agent Workload
Current work distribution across human agents. Each row shows the agent, their status (Available / Busy / Wrap-up / Offline), and current counts per channel.
***
## Custom Reporting tab
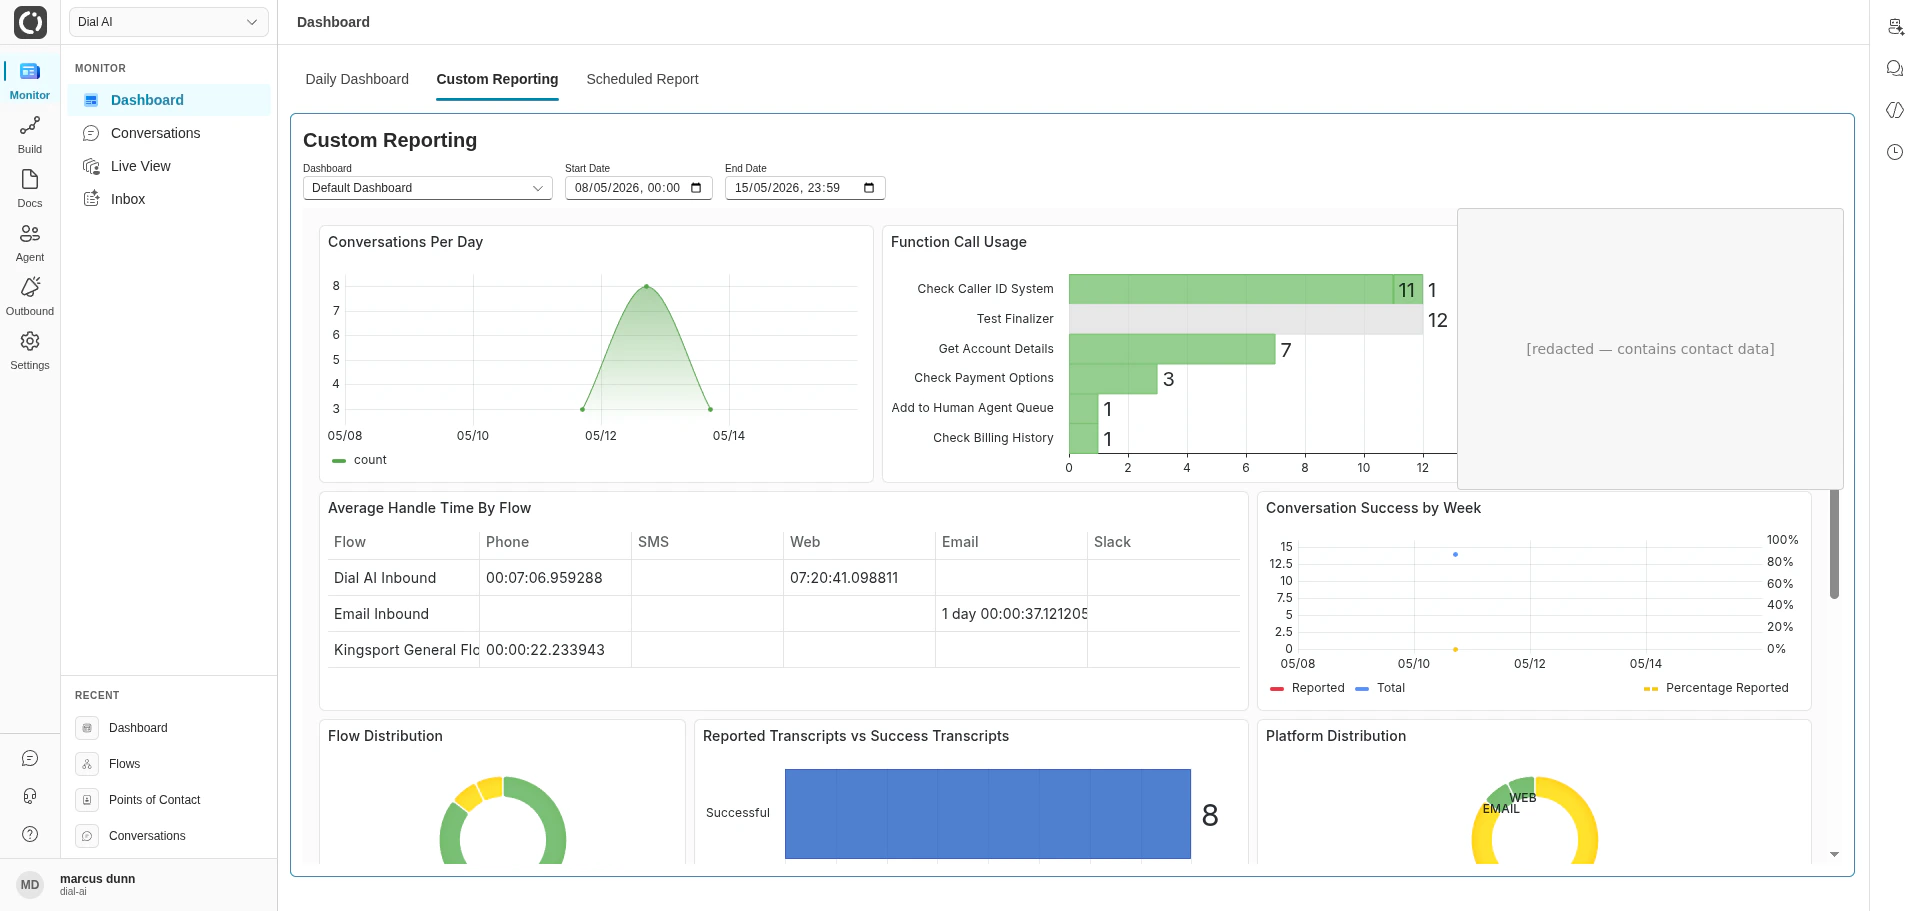
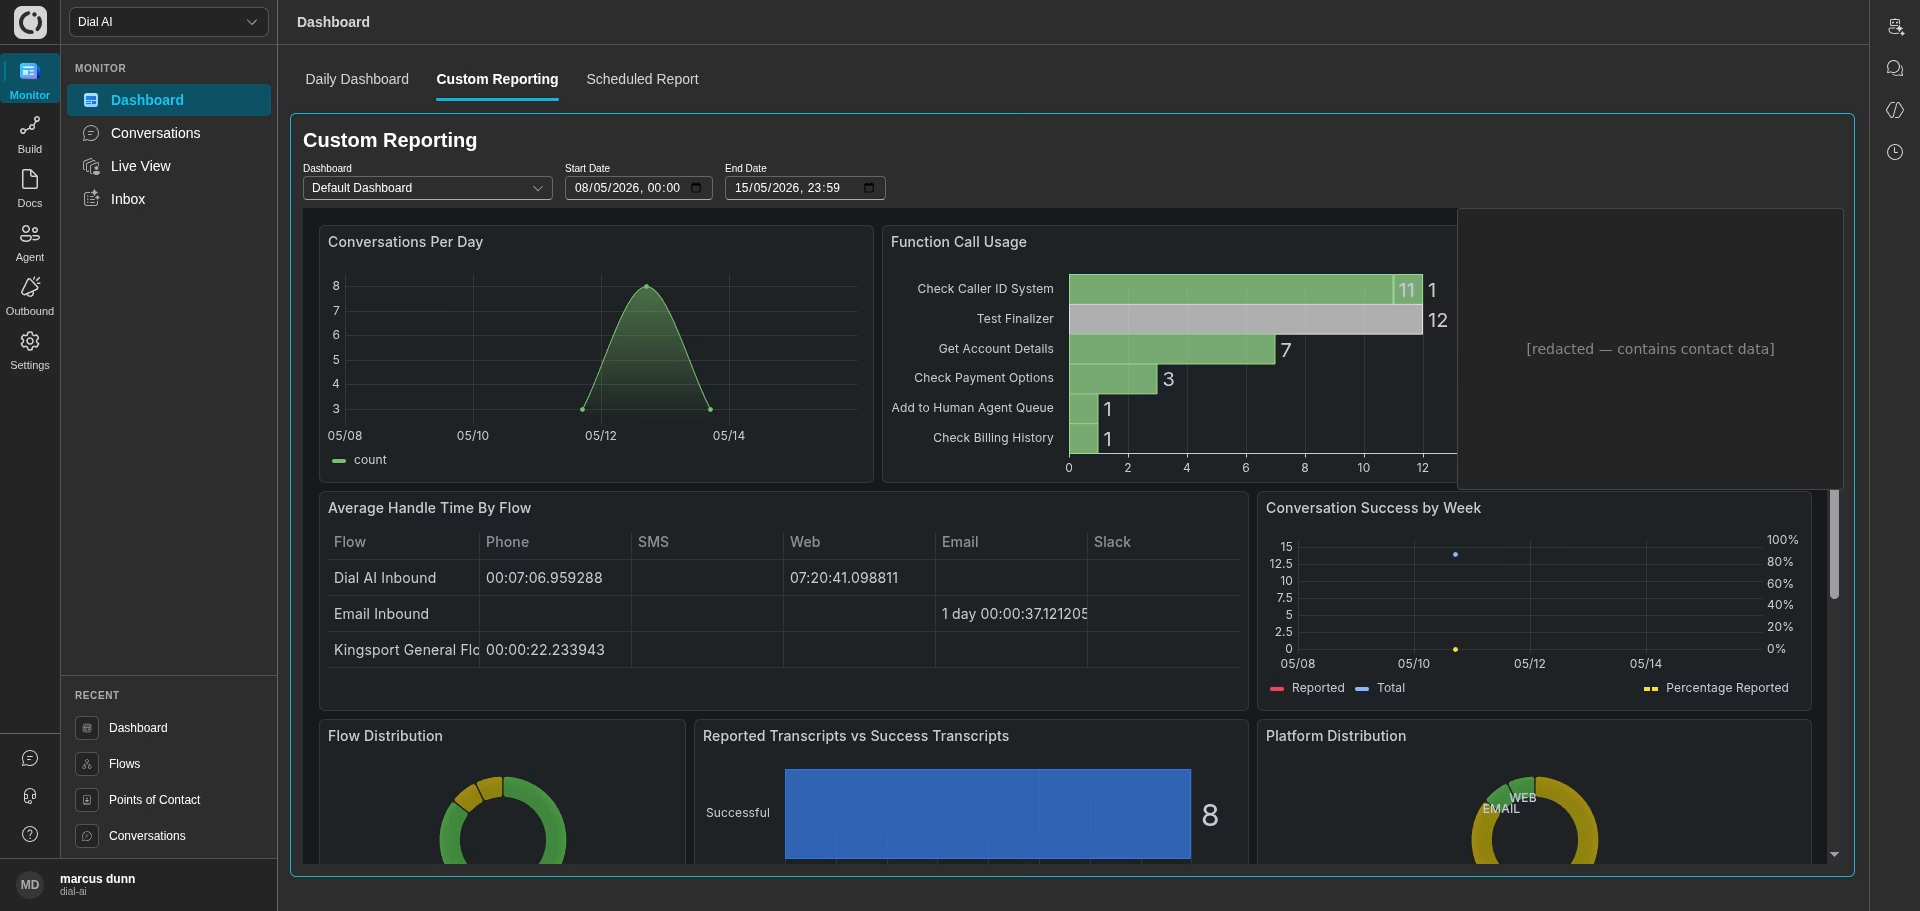 Use Custom Reporting for deeper analysis and historical trending.
* **Dashboard selector** — pick a reporting template. The **Default Dashboard** comes pre-configured; any custom dashboards saved in your organization also appear here.
* **Start Date / End Date** — pick the analysis window. Useful for week-over-week or month-over-month comparisons, or investigating a specific historical event.
* **Configurable widgets** — once a range is selected, the dashboard populates with line charts, bar charts, pie charts, and tables filterable by channel, skill group, agent, and other dimensions. Most widgets export to CSV.
***
## Scheduled Report tab
Use Custom Reporting for deeper analysis and historical trending.
* **Dashboard selector** — pick a reporting template. The **Default Dashboard** comes pre-configured; any custom dashboards saved in your organization also appear here.
* **Start Date / End Date** — pick the analysis window. Useful for week-over-week or month-over-month comparisons, or investigating a specific historical event.
* **Configurable widgets** — once a range is selected, the dashboard populates with line charts, bar charts, pie charts, and tables filterable by channel, skill group, agent, and other dimensions. Most widgets export to CSV.
***
## Scheduled Report tab
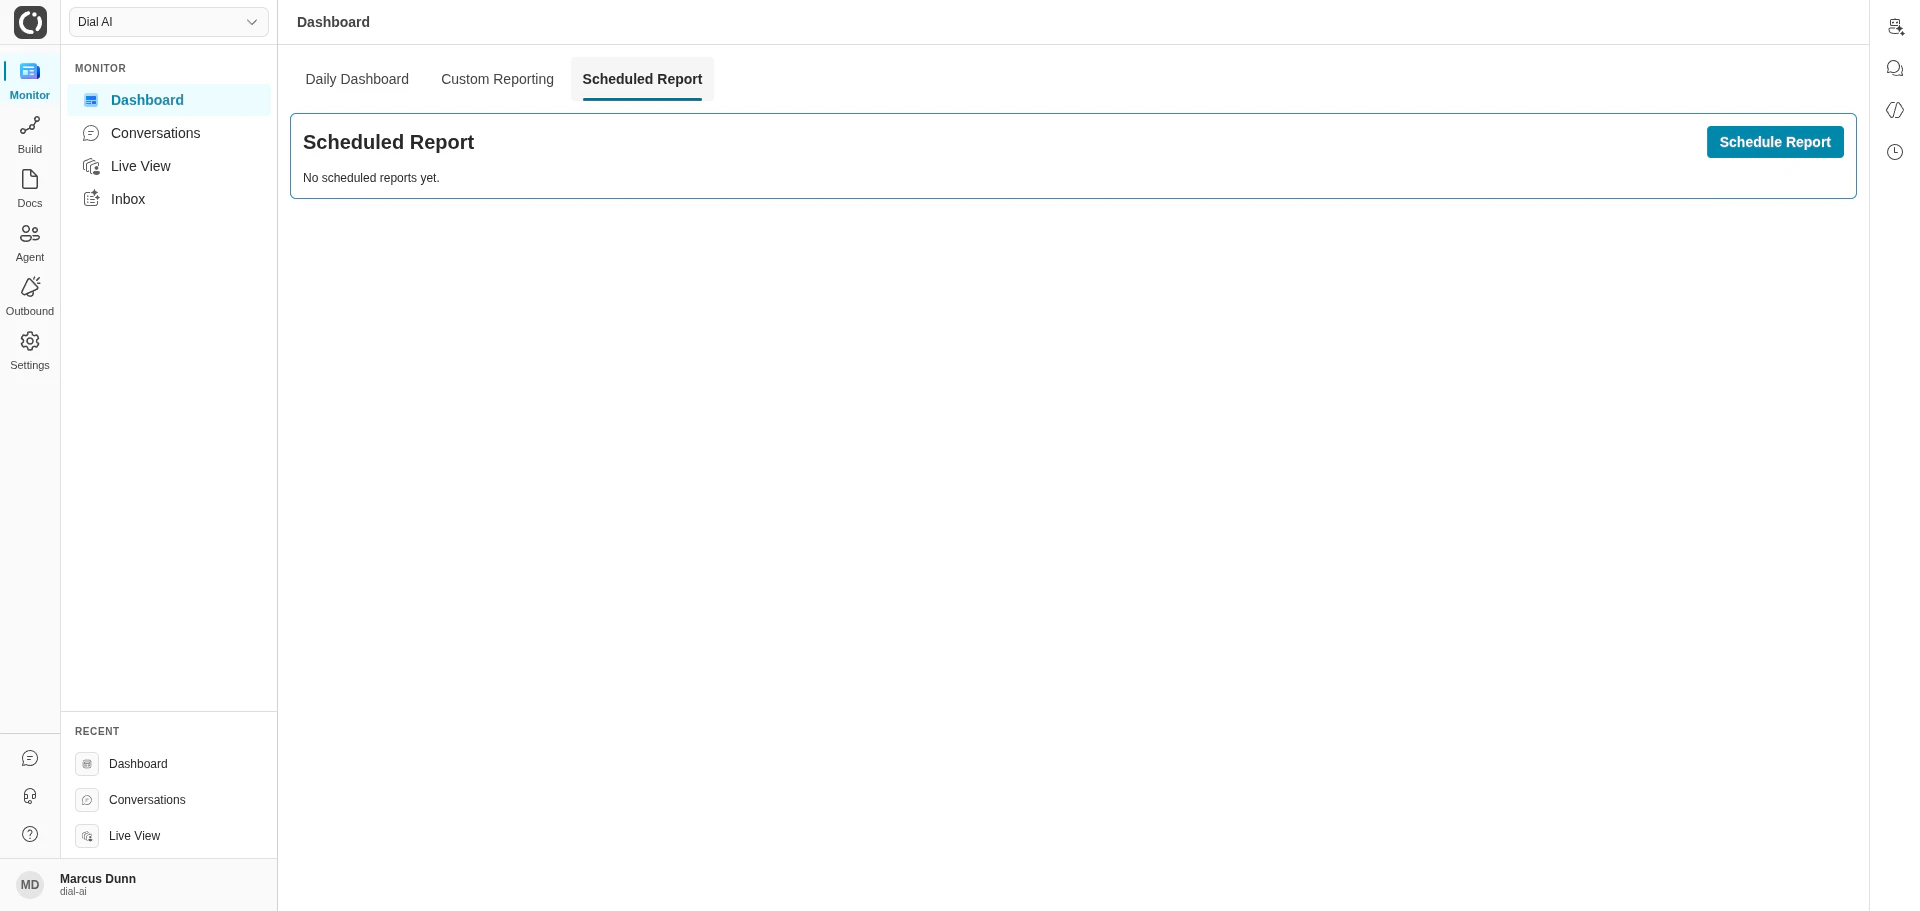
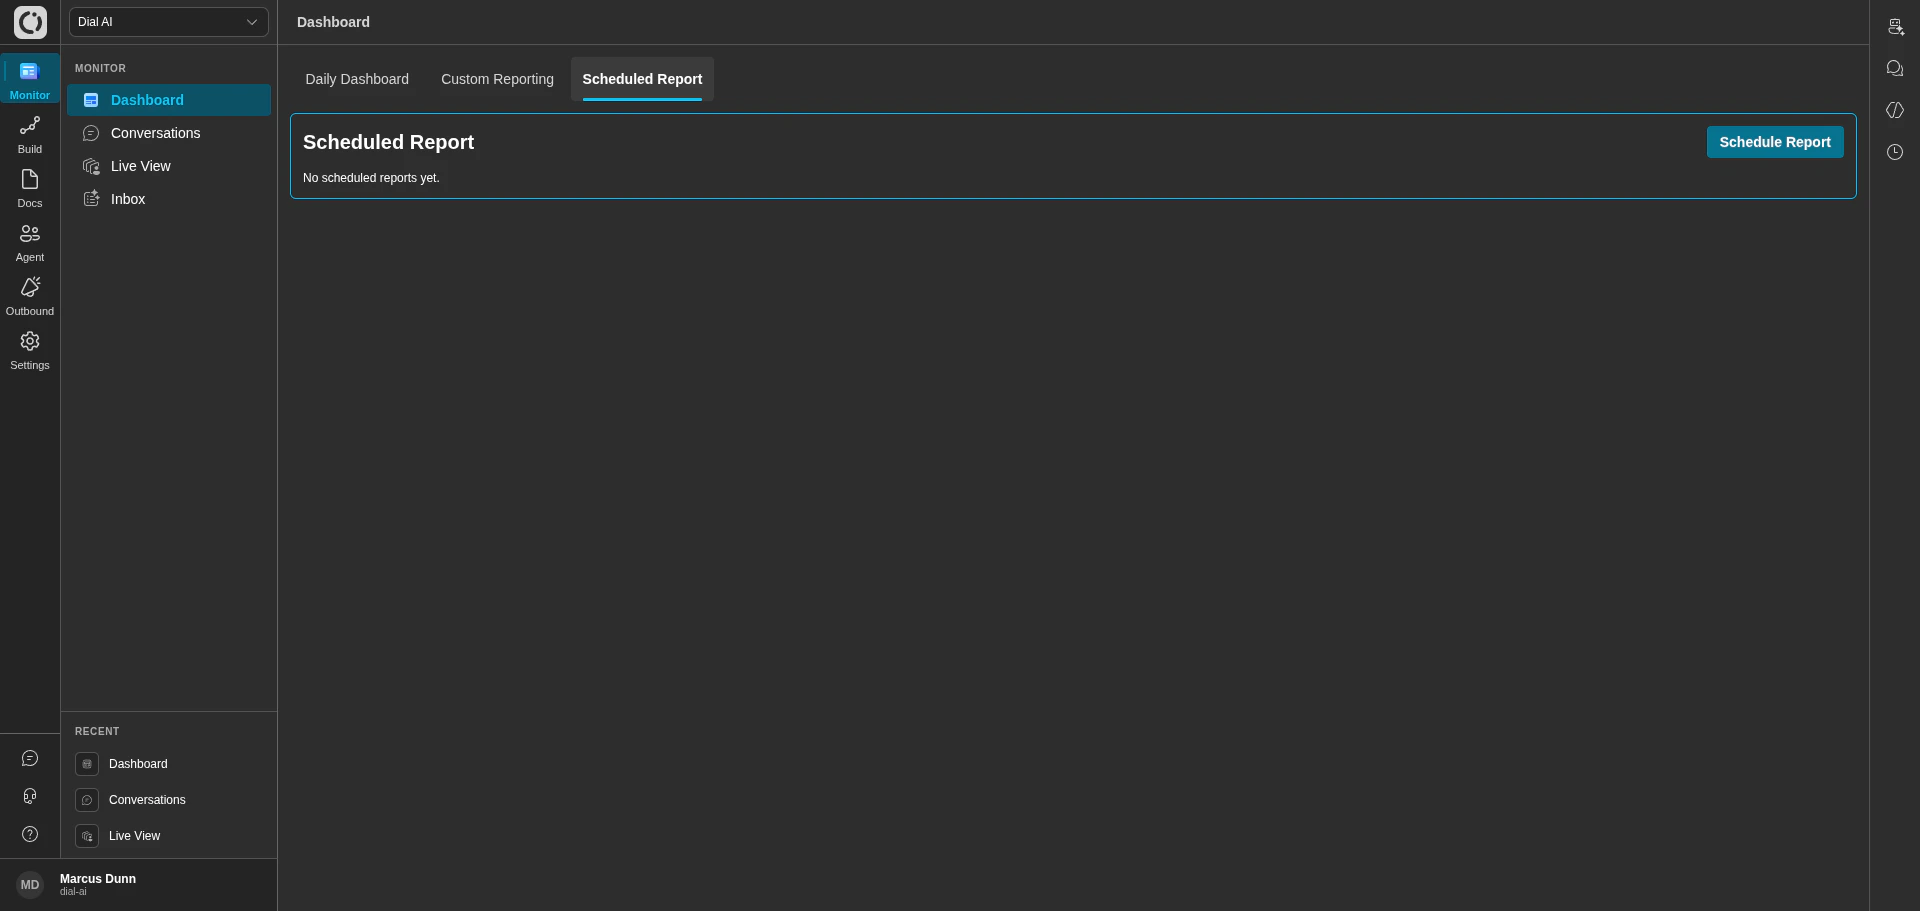 Set up recurring reports that are delivered automatically, so stakeholders don't have to remember to pull them.
Opens the configuration dialog.
* **Report name** — what shows up in the recipient's inbox.
* **Template** — pick a pre-built report or any custom dashboard.
* **Frequency** — daily, weekly, monthly.
* **Delivery time** — the time of day the report runs.
* **Recipients** — email addresses.
* **Format** — PDF, Excel, or email summary.
Scheduled reports can be viewed, edited, paused, or deleted from the same tab.
***
## Related
Search and review individual transcripts.
Real-time monitoring of in-flight conversations.
Take over conversations that need human help.
Set up recurring reports that are delivered automatically, so stakeholders don't have to remember to pull them.
Opens the configuration dialog.
* **Report name** — what shows up in the recipient's inbox.
* **Template** — pick a pre-built report or any custom dashboard.
* **Frequency** — daily, weekly, monthly.
* **Delivery time** — the time of day the report runs.
* **Recipients** — email addresses.
* **Format** — PDF, Excel, or email summary.
Scheduled reports can be viewed, edited, paused, or deleted from the same tab.
***
## Related
Search and review individual transcripts.
Real-time monitoring of in-flight conversations.
Take over conversations that need human help.