Summary
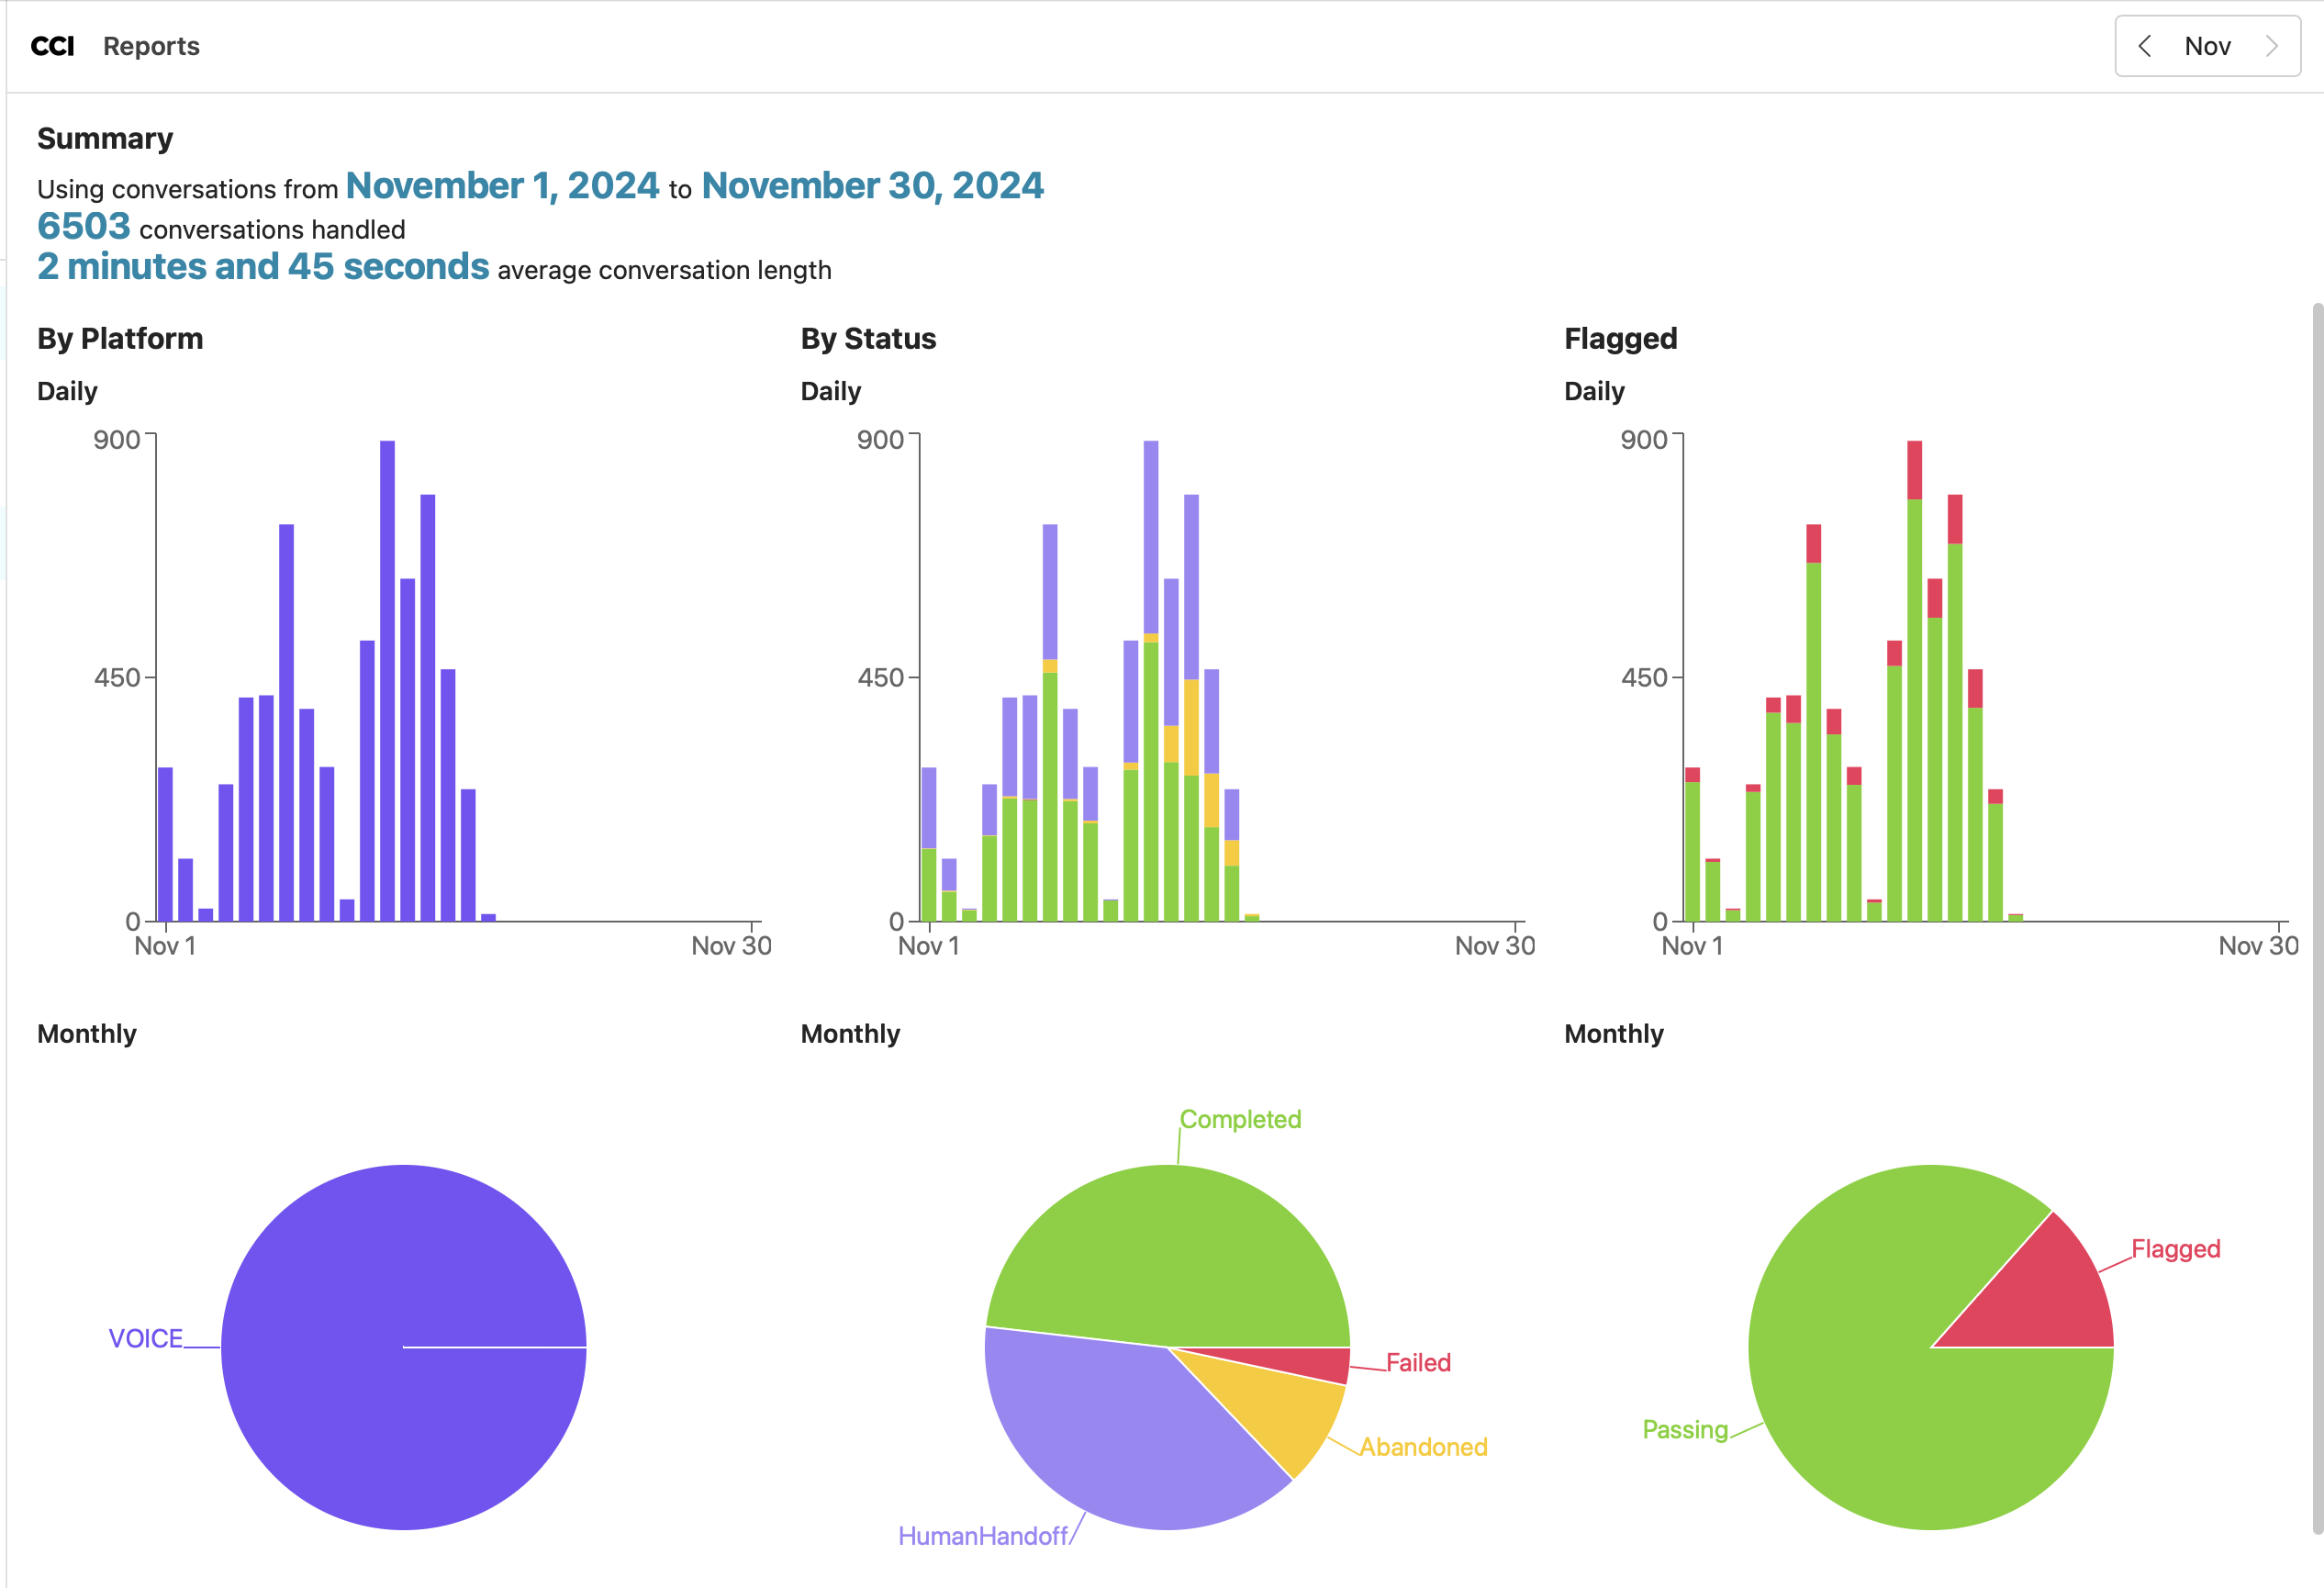
At the top of the Reports page, a summary section displays:- Date Range: The range of dates for which the data is being analyzed, shown in blue. You can adjust this range to view metrics for different time periods.
- Total Conversations Handled: The total number of conversations completed within the selected date range.
- Average Conversation Length: The average duration of conversations, providing a quick indicator of engagement time.
Metrics Visualizations
The main section of the Reports page contains several charts that display daily and monthly data across different categories. These visualizations include:Conversations By Platform
The By Platform chart shows the daily and monthly breakdown of conversations by the platform used (e.g., Voice, SMS, Web, or Email).- Daily Chart: Displays the volume of conversations handled each day.
- Monthly Chart: A pie chart summarizing the distribution of conversations across different platforms for the entire month.
Conversations By Status
The By Status chart categorizes conversations based on their outcomes:- Completed: Conversations that were successfully concluded.
- Abandoned: Conversations that ended prematurely, possibly due to customer disengagement.
- Failed: Conversations that encountered system errors or issues preventing completion.
- Human Handoff: Conversations that were transferred to a human representative for further assistance.
- Daily Chart: Shows the number of conversations with each status on a daily basis.
- Monthly Chart: A pie chart displaying the overall percentage breakdown of conversation statuses for the month.
Flagged Conversations
The Flagged chart highlights conversations that were flagged for review by the system. Flagged conversations may require further inspection for quality control or troubleshooting.- Daily Chart: Displays the number of flagged conversations each day.
- Monthly Chart: A pie chart showing the proportion of flagged versus passing conversations for the month.