Mission Control: the Daily Dashboard tab
Accessing the Dashboard
Navigate to Monitor > Dashboard in the left sidebar. The page opens to three tabs:- Daily Dashboard — real-time and day-to-date metrics
- Custom Reporting — configurable analytics with custom date ranges
- Scheduled Report — automated report delivery on a recurring schedule
Daily Dashboard tab
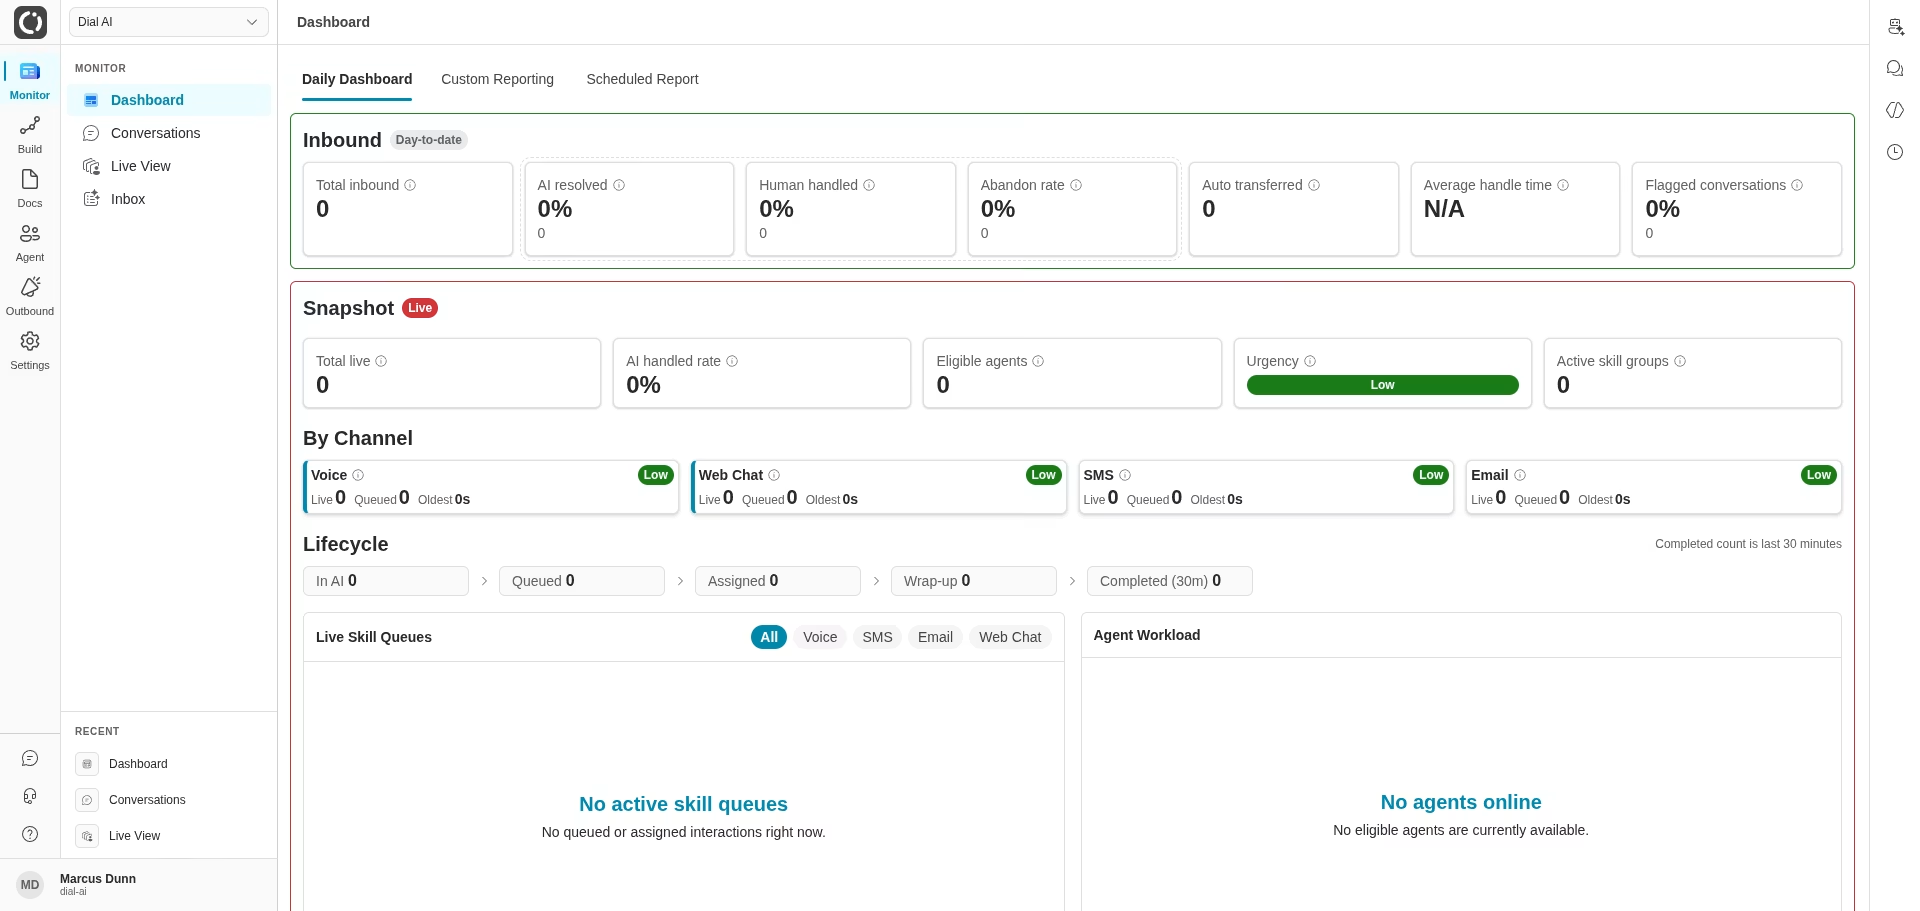
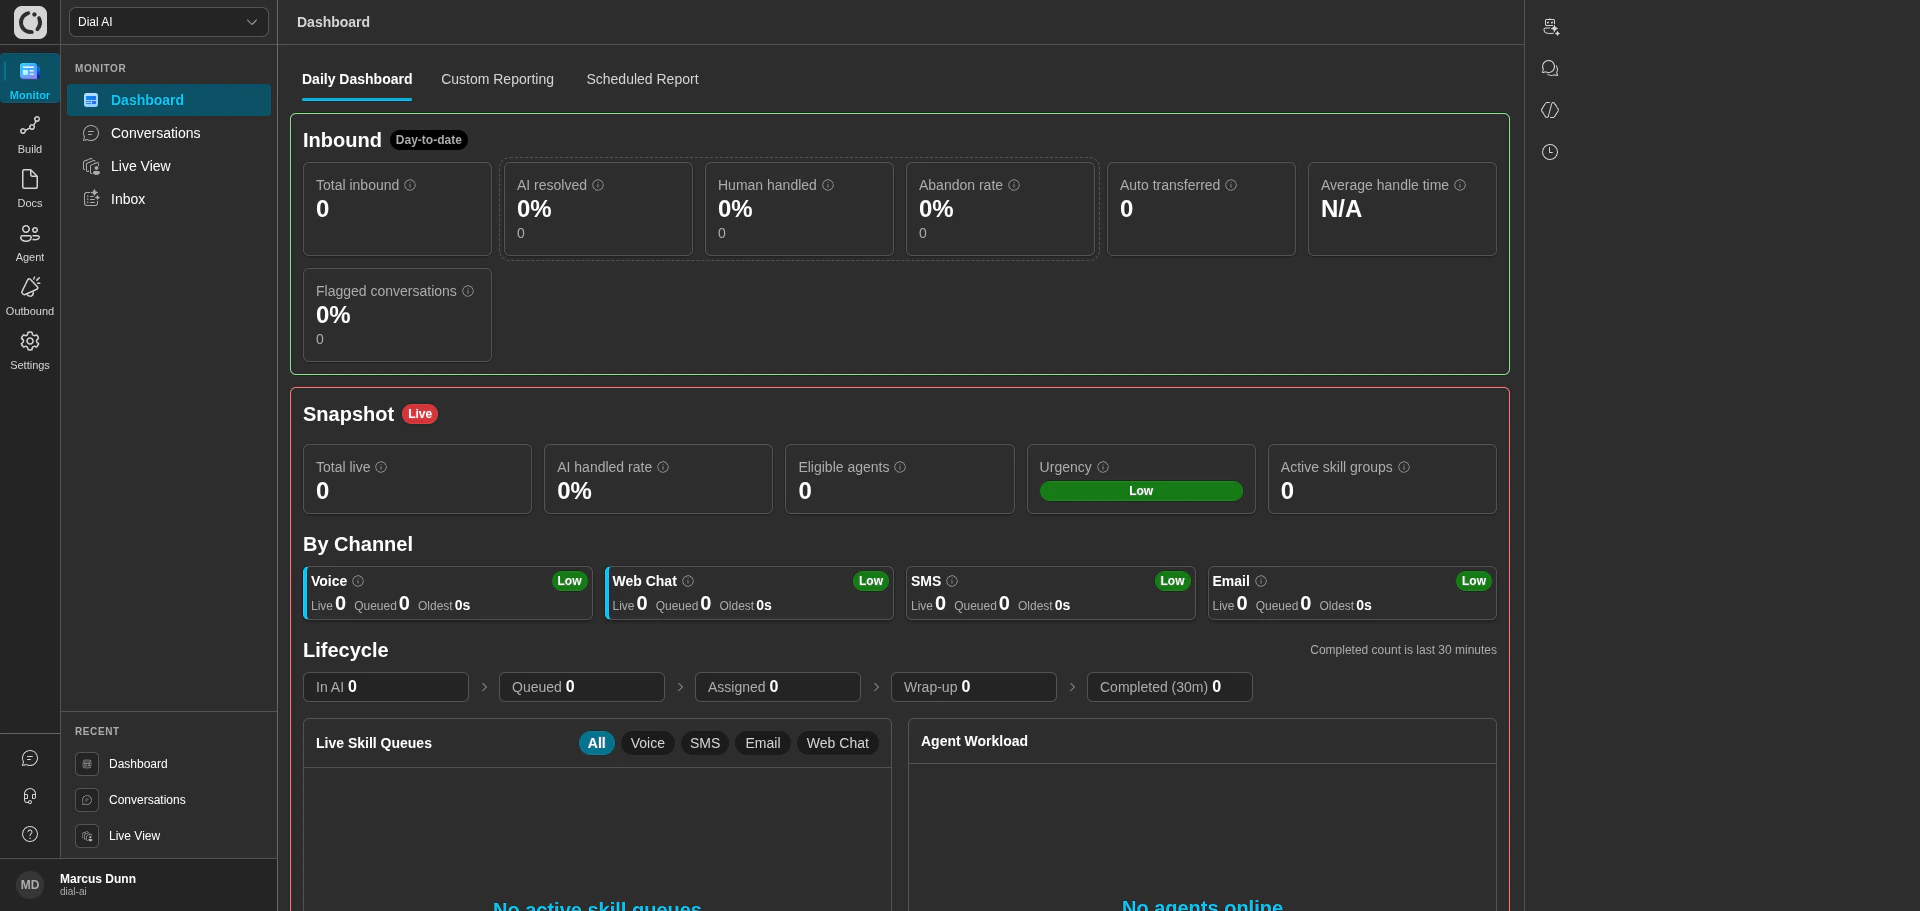
The Daily Dashboard balances today’s accumulating numbers (Today) with a live operational pulse (Snapshot, By Channel, Lifecycle, Live Skill Queues, Agent Workload).Today (day-to-date)
Cards along the top show what has accumulated since the start of today:- Total inbound — every inbound interaction received today, excluding still-in-progress conversations and auto-transferred calls.
- AI resolved — share of today’s resolved inbound interactions that the AI fully handled.
- Human handled — share that required a human agent.
- Abandon rate — share that were abandoned before resolution.
- Auto transferred — inbound calls auto-routed to a human outside the AI flow. Tracked separately and not counted in Total inbound.
- Average handle time — mean time from assignment to completion for today’s human-handled conversations.
- Flagged conversations — share of resolvable inbound conversations flagged for review today.
Snapshot (live)
Real-time operational status across the whole platform:- Total live — active interactions across AI, queued, assigned, and wrap-up.
- AI handled rate — share of live interactions currently handled by AI.
- Eligible agents — human agents online and eligible to take interactions.
- Urgency — Low / Medium / High based on queued load vs available agents (no queue = Low, no agents = High).
- Active skill groups — distinct skill sets across queued and assigned work.
By Channel
Per-channel cards (Voice, Web Chat, SMS, Email) show Live, Queued, Oldest wait time, and a per-channel urgency badge. Channel urgency thresholds: Voice and Web Chat at 1m/3m, SMS at 5m/15m, Email at 30m/2h (Medium / High respectively).Lifecycle
A pipeline visualization of in-flight work: In AI → Queued → Assigned → Wrap-up, plus a Completed (30m) column showing how many wrapped in the last 30 minutes.Live Skill Queues
A queue list filtered by channel — tabs for All, Voice, SMS, Email, and Web Chat. Shows individual conversations waiting for assignment, useful for supervisors managing agent assignment manually.Agent Workload
Current work distribution across human agents. Each row shows the agent, their status (Available / Busy / Wrap-up / Offline), and current counts per channel.Custom Reporting tab
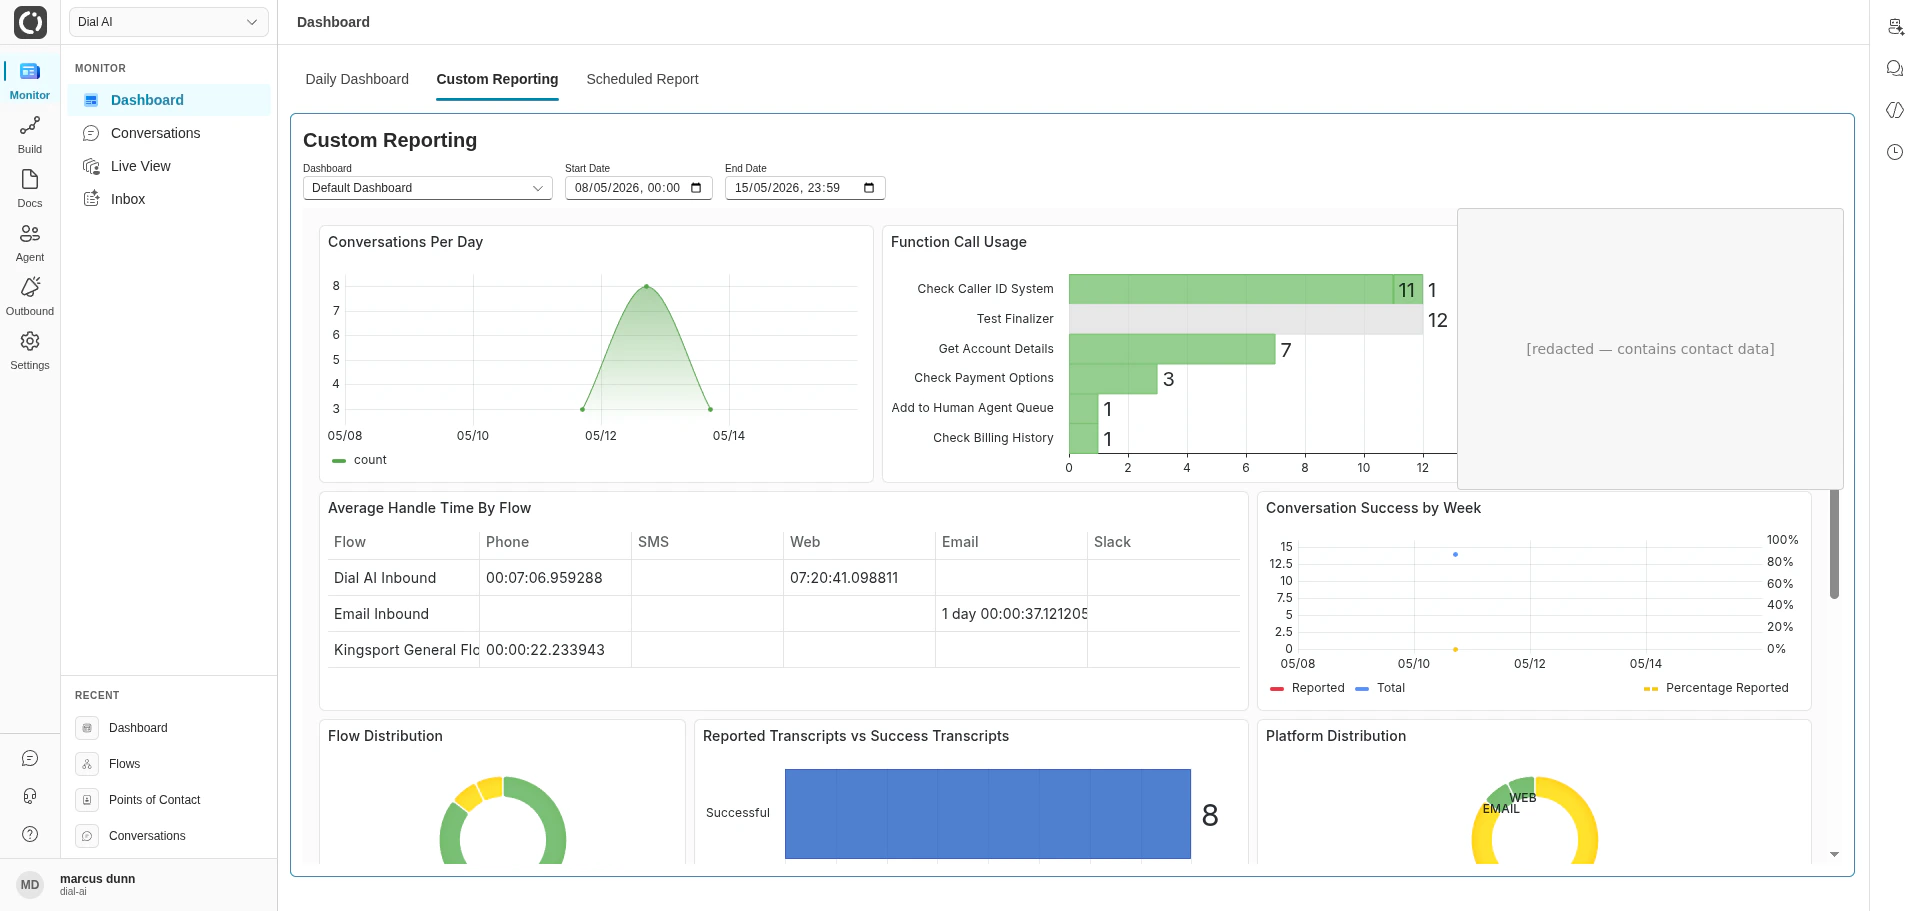
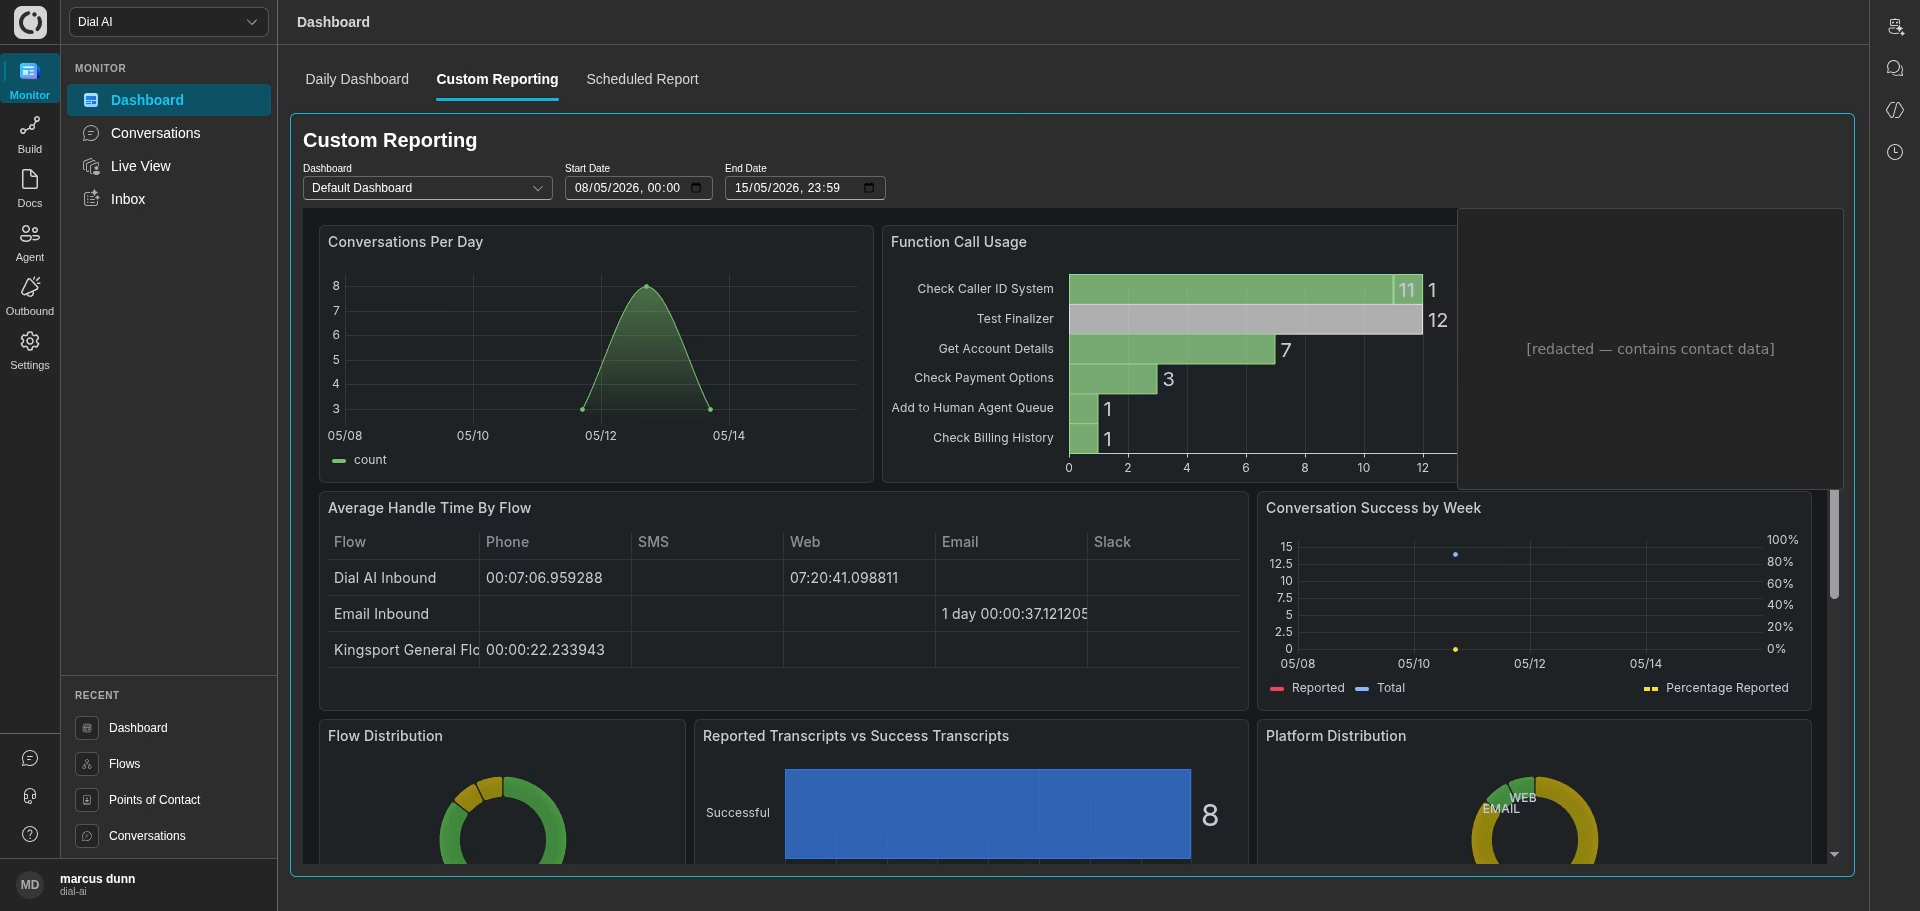
Custom Reporting with date range and dashboard selector
- Dashboard selector — pick a reporting template. The Default Dashboard comes pre-configured; any custom dashboards saved in your organization also appear here.
- Start Date / End Date — pick the analysis window. Useful for week-over-week or month-over-month comparisons, or investigating a specific historical event.
- Configurable widgets — once a range is selected, the dashboard populates with line charts, bar charts, pie charts, and tables filterable by channel, skill group, agent, and other dimensions. Most widgets export to CSV.
Scheduled Report tab
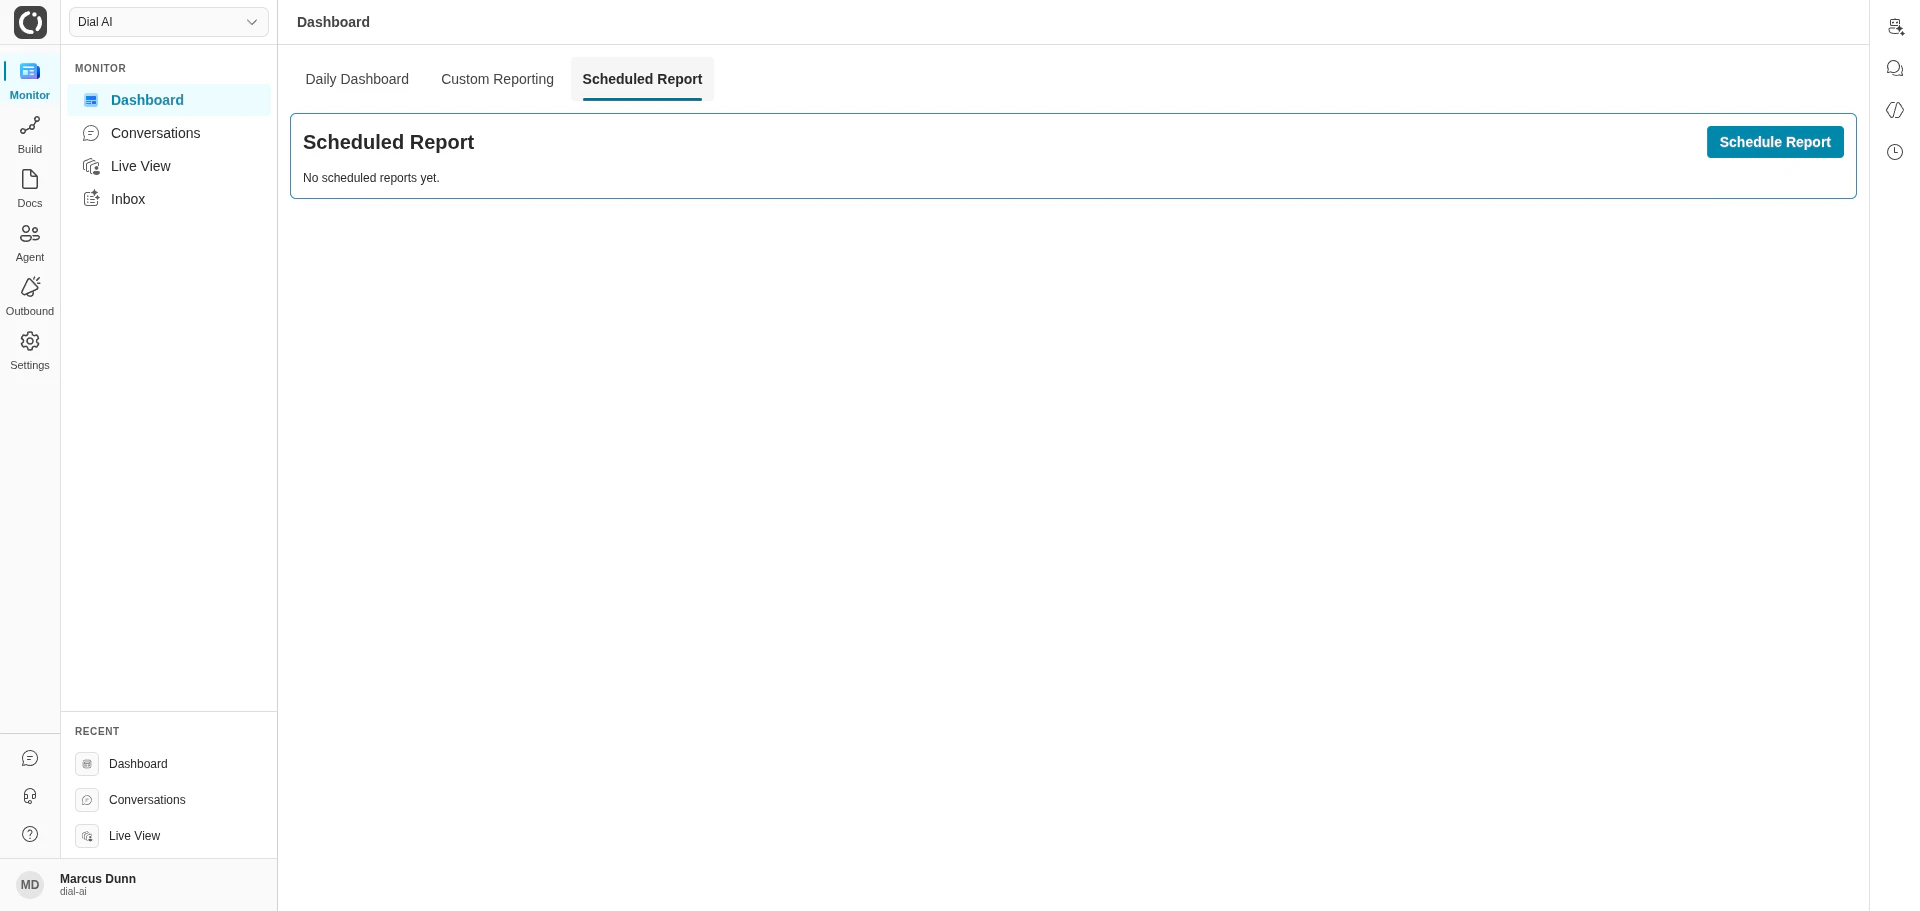
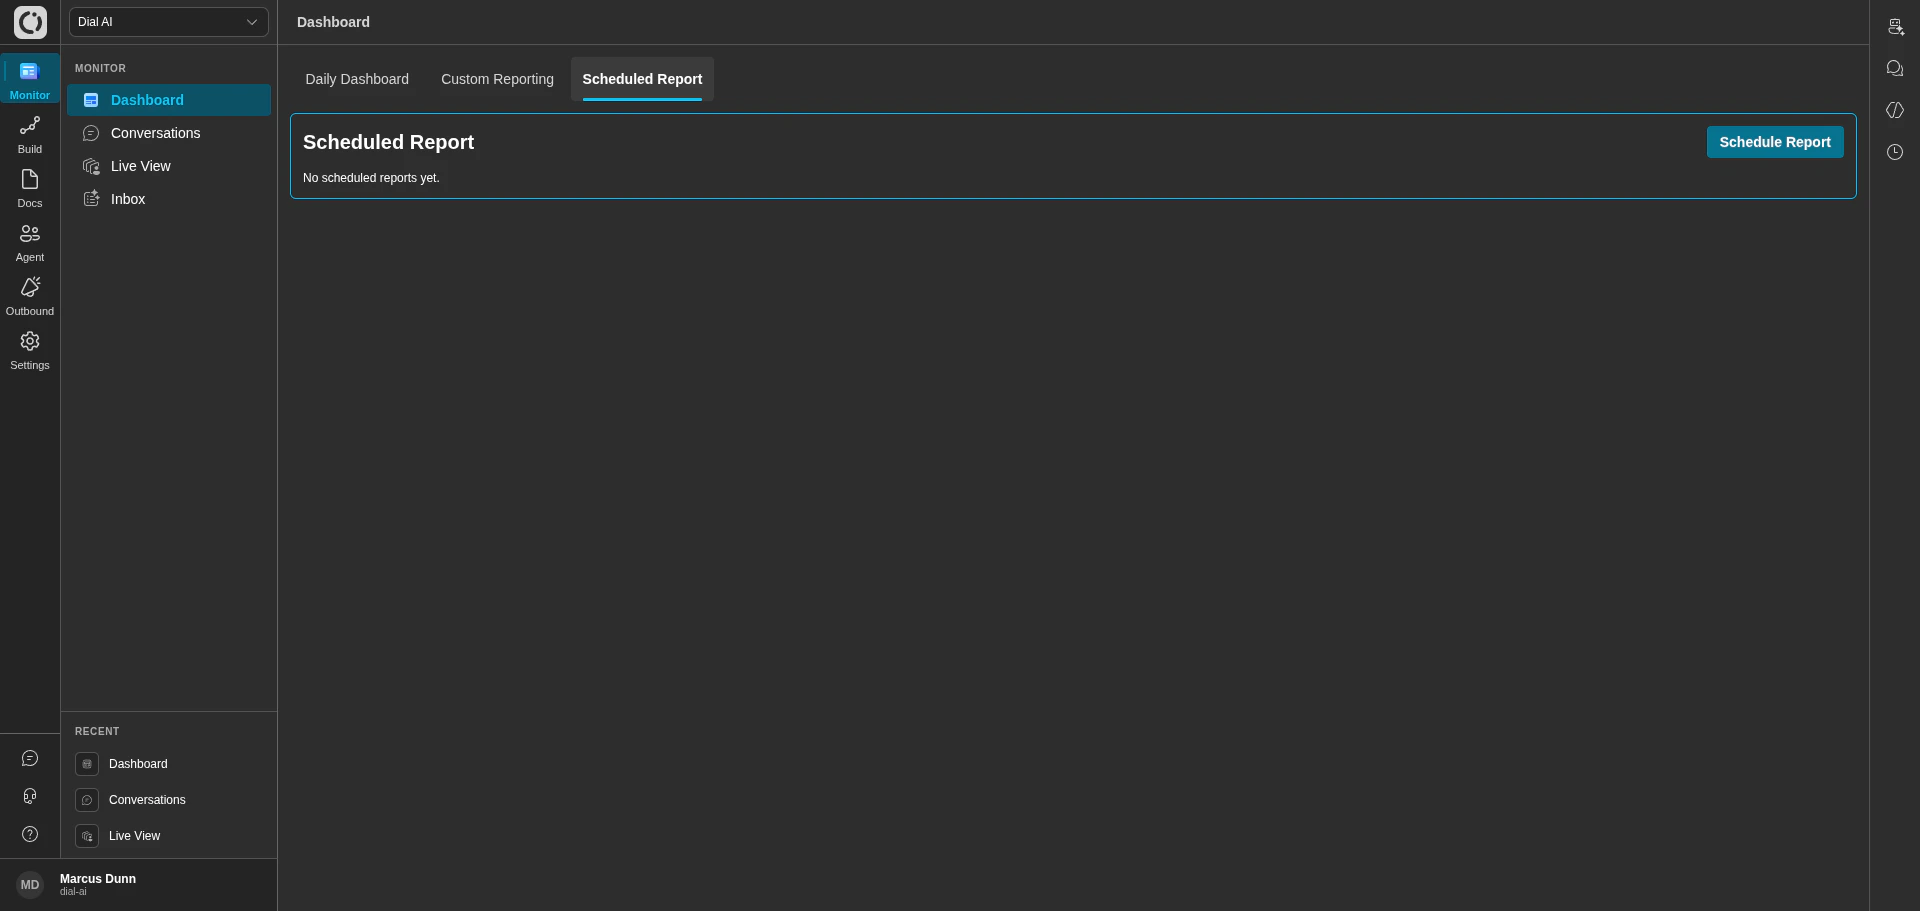
Scheduled Report tab
1
Click Schedule Report
Opens the configuration dialog.
2
Configure the report
- Report name — what shows up in the recipient’s inbox.
- Template — pick a pre-built report or any custom dashboard.
- Frequency — daily, weekly, monthly.
- Delivery time — the time of day the report runs.
- Recipients — email addresses.
- Format — PDF, Excel, or email summary.
3
Review and edit later
Scheduled reports can be viewed, edited, paused, or deleted from the same tab.
Related
Conversations
Search and review individual transcripts.
Live View
Real-time monitoring of in-flight conversations.
Inbox
Take over conversations that need human help.